Predictive stress analysis that helps the team act before weak zones become expensive problems
Predictive stress analysis is not just about seeing today's weak spots. It is about building a repeatable field record, combining that record with other signals, and forecasting where the crop is likely to slip next so the team can inspect or intervene earlier than a reactive workflow allows.
Recommended predictive analysis system
This product stack belongs near the top because predictive analysis only works when the capture system is dependable enough to create repeatable multi-date observations. If the flight cadence breaks, the insight quality drops with it.
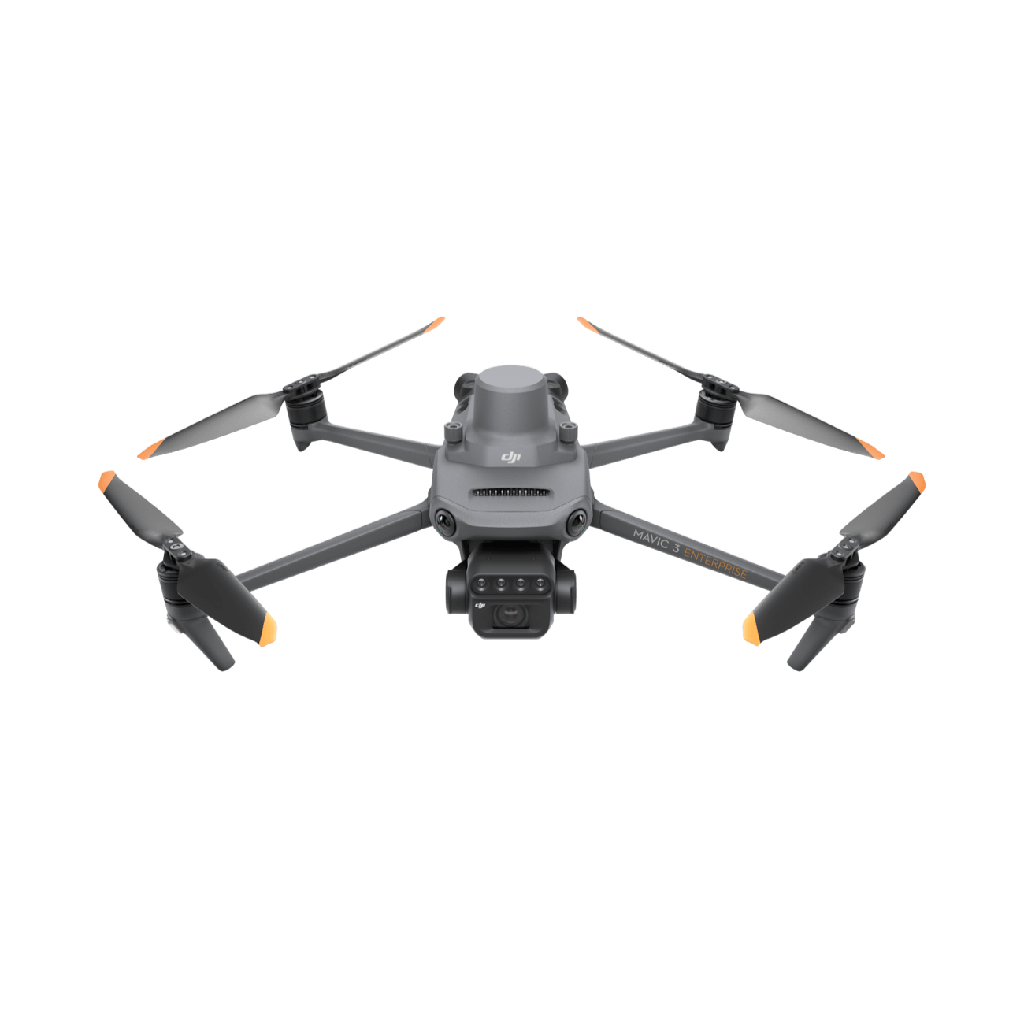
DJI Mavic 3 Multispectral (M3M)
Builds the repeatable image record required for predictive modeling by capturing comparable multispectral and RGB data over the same fields across the season.
Models use trend, not just snapshots
Predictive workflows look at how spectral signals change over time, not only whether a zone looks weak in a single image.
Time-series flights create usable signal history
Repeated M3M flights help teams compare whether the field is stabilizing, drifting downward, or splitting into new weak areas.
Earlier action window
The main advantage is time: pre-emptive scouting or treatment before the issue becomes obvious everywhere and harder to correct.
Priority ranking by risk
Risk maps help agronomy teams focus on the acres most likely to deteriorate next instead of spreading effort evenly across the whole farm.
What predictive stress analysis should answer
A predictive workflow is only worth the added complexity if it helps the operation act sooner and more selectively than standard scouting.
Which zones are most likely to deteriorate over the next few days or the next irrigation or weather event?
What historical or multi-date pattern suggests the issue is building rather than remaining stable?
Where should the agronomy team inspect first if labor or aircraft time is limited?
What action should happen now: ground-truthing, targeted treatment, closer monitoring, or no intervention yet?
Operational workflow
The predictive loop is repeated capture, consistent alignment, model interpretation, and prioritized follow-up.
- 1
Build a repeatable flight cadence
Capture the same fields on a consistent interval so the dataset shows how stress is evolving rather than only how the crop looked one day.
- 2
Combine drone data with other field signals
Layer weather, irrigation, soil, yield, or operational context alongside the imagery so predictions reflect real field drivers instead of image patterns alone.
- 3
Model the risk trajectory
Use time-series comparison or ML-supported interpretation to identify which zones are likely to weaken next, not only which ones are currently weak.
- 4
Generate a risk-priority map
Translate the output into a ranked action map so the team knows where to scout, sample, or intervene before the crop visibly declines.
- 5
Close the loop with new observations
Each follow-up flight refines the picture and strengthens the operation's ability to forecast which patterns matter and which ones are noise.
Where predictive analysis creates real value
Time-series imagery can reveal where decline is accelerating, helping the team scout or treat before the issue spreads visually across a larger area.
Instead of reacting to one bad flight, teams can watch whether the crop is recovering after a management change or continuing to slide.
Predictive maps help rank which blocks or zones deserve immediate labor and aircraft time when resources are tight.
What your team should receive after a predictive analysis cycle
A multi-date comparison of key field zones, not a single isolated map.
A ranked risk layer showing where future deterioration is most likely.
A concise explanation of which signals are driving the prediction.
A clear next action: inspect, monitor, intervene, or feed the zones into a treatment workflow.
Research base
This page reflects current research on UAV multispectral time-series analysis, early disease and canopy decline detection, and yield-risk modeling from repeated aerial observations.
Works best with
Regular Mavic 3M flights, consistent field geometry, and disciplined ground-truthing. When the output needs to become a treatment plan, pair this workflow with Variable Rate Application.